
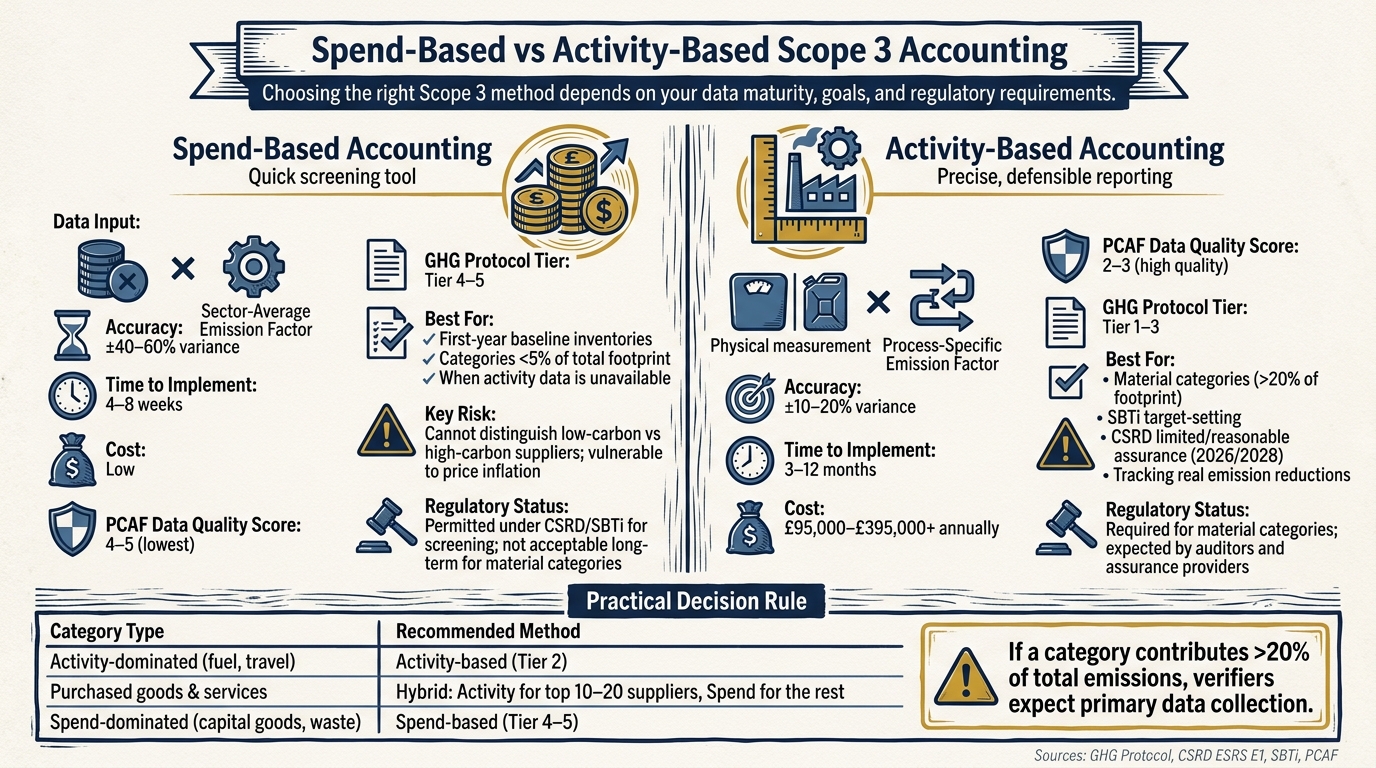
When it comes to calculating Scope 3 emissions, you have two main approaches: spend-based and activity-based accounting. Each has its strengths and weaknesses, and choosing the right one depends on your goals, available data, and regulatory requirements.
- Spend-based accounting: Uses procurement spend multiplied by industry-average emission factors. It's quick (4–8 weeks), inexpensive, and works well for initial screening. However, it's less accurate (±40–60% variance) and doesn't track real reductions effectively.
- Activity-based accounting: Relies on physical data (e.g., kg, kWh, km) and process-specific emission factors. It’s more precise (±10–20% variance) and suitable for tracking reductions, but it takes longer (3–12 months) and requires more effort and supplier engagement.
Quick Comparison
| Method | Data Input | Accuracy | Time to Implement | Best Use Case |
|---|---|---|---|---|
| Spend-based | Procurement spend (£) | ±40–60% | 4–8 weeks | Initial screening, low-priority categories |
| Activity-based | Physical units (kg, etc.) | ±10–20% | 3–12 months | High-emission or material categories |
Key takeaway: Start with spend-based for a quick overview, but shift to activity-based for material categories and regulatory compliance. Auditors now expect companies to transition to higher-quality data for accurate, defensible reporting.
Spend-Based vs Activity-Based Scope 3: Key Differences at a Glance
Scope 3 Data Hierarchy and What Verifiers Expect
The GHG Protocol Data Hierarchy
The Greenhouse Gas (GHG) Protocol outlines a structured approach to assessing Scope 3 data quality. At the top of this hierarchy sits Tier 1: supplier-specific primary data, which refers to actual carbon footprint information provided directly by suppliers. Following this is Tier 2: hybrid data, which combines physical activity information with secondary emission factors. Tier 3: activity-based data measures emissions using physical units like kilograms, kilowatt-hours, or kilometres. At the bottom is Tier 4: spend-based EEIO estimates, where procurement spend is multiplied by an industry-average emission factor. This hierarchy helps determine the most defensible method for assessing emissions in each category, and auditors rely on it to evaluate data quality.
Spend-based methods are primarily used for initial assessments - mapping out supply chains and identifying emission hotspots. However, they are not considered a long-term substitute for higher-quality data in key categories. As Jeremiah Say, Lead Systems Architect at GreenCalculus, puts it:
"Spend-based is a screening tool and a completeness backstop, not a destination." [6]
What Auditors and Assurance Providers Look For
When verifying Scope 3 methodologies, auditors focus on whether the approach is transparent, consistent, and shows a clear path for improvement. Their evaluation typically centres on three key areas:
- Data lineage: Ensuring a traceable connection between financial records and emission factors.
- Materiality justification: Providing clear reasoning for the inclusion or exclusion of each Scope 3 category, supported by documented methodologies.
- A migration roadmap: While companies aren’t expected to achieve 100% activity-based data immediately, verifiers look for a credible plan to shift material categories away from spend-based methods within three years [1].
Additionally, under the EU's Corporate Sustainability Reporting Directive (CSRD) and its ESRS E1 standards, organisations must disclose the proportion of their Scope 3 inventory derived from primary versus secondary data [4]. The UK's Procurement Policy Note 006 (PPN 006) also highlights gaps in Scope 3 methodologies as a recurring issue for government contracts. These regulations are set to become stricter, with limited assurance for Scope 3 data required by 2026 and reasonable assurance by 2028 [1].
These evolving criteria shape how verifiers assess inventories that mix data from different sources.
How Verifiers Read Mixed-Method Inventories
Verifiers apply additional practical rules when reviewing mixed-method inventories. One common approach is the "5% rule", which allows spend-based estimates for categories contributing less than 5% of the total emissions footprint. This is considered acceptable when the cost of obtaining more accurate data outweighs the benefits [7]. For less critical suppliers, spend-based data is often deemed proportionate.
However, for material categories - those accounting for a significant portion of emissions - verifiers expect higher-quality data, such as supplier-specific or hybrid inputs. Continued reliance on spend-based methods for these categories, without a clear plan for improvement, is not acceptable.
Switching databases mid-cycle, such as moving from EXIOBASE to GLORIA, is treated as a major recalculation by verifiers and requires restating the base year. Similarly, mixing Global Warming Potential (GWP) sets - for instance, using DEFRA/Eurostat's IPCC AR5 factors alongside the US EPA's AR6 factors - without proper conversion is flagged as a methodological error [6].
The table below outlines how key frameworks approach spend-based data:
| Framework | Stance on Spend-Based Data |
|---|---|
| EU CSRD (ESRS E1) | Permitted, but requires disclosure of primary versus secondary data; strong emphasis on transitioning material categories [4] |
| SBTi | Acceptable for initial screening but demands a credible migration plan for material categories [1] |
| UK PPN 006 | Required for government contracts; addressing Scope 3 methodology gaps is a common challenge [3] |
| PCAF | Considered the lowest quality (Score 4–5); only used when physical data is unavailable [6] |
Spend-Based Scope 3 Accounting
How Spend-Based Accounting Works
Spend-based accounting estimates emissions by using procurement expenditure data - often pulled from ERP systems - and multiplying it by a sector-average emission factor (measured in kg CO₂e per unit of currency). These emission factors come from Multi-Regional Input-Output (MRIO) databases like EXIOBASE (for European and global supply chains) or the US EPA USEEIO model (for North American supply chains).
The calculation itself is simple: E = Σ (Spend × Deflator × EF). Here, the deflator adjusts for inflation because MRIO factors are tied to a specific price base year (e.g., the EPA uses 2022 USD). Skipping this adjustment can lead to errors of 20–30% over multiple years [4]. For instance, a US services company with £750,000-equivalent nominal spend in 2026 overstated emissions by 16% simply by ignoring the deflation step [6]. While this method is quick, its accuracy can vary significantly. Let’s take a closer look at the pros and cons of this approach.
Strengths and Weaknesses
The biggest advantage of spend-based accounting is speed. A company can create a complete inventory covering all 15 Scope 3 categories within four to eight weeks, using only financial data and without involving suppliers [1]. This makes it particularly useful for identifying which areas need further attention.
However, the method has its limitations. It assumes that every pound spent in a sector has the same carbon intensity, which means it can’t distinguish between low-carbon and high-carbon suppliers. Additionally, it’s vulnerable to inflation and currency changes, meaning a supplier’s price increase could make emissions appear higher - even if their actual output hasn’t changed.
"Spend-based data answers one question reasonably well: Roughly how big is our Scope 3 footprint. It does not answer... What actions will meaningfully reduce emissions?" - Josh Prigge, Carbon Consultant, North Star Carbon [5]
When Spend-Based Is Acceptable
Despite its limitations, spend-based accounting is still a reasonable choice in certain scenarios. It works well for first-year inventories, where the goal is to establish a baseline and identify high-impact areas across all categories. It’s also suitable for categories that are less material - those contributing less than 5% of the total footprint, such as office supplies or catering - where gathering detailed data would be more costly than beneficial [6]. Finally, it’s an option when activity data is unavailable due to supplier systems, lack of disclosure, or fragmented information. In these cases, verifiers expect a written explanation for why primary data couldn’t be used [7].
How Verifiers Assess Spend-Based Data
Given its ±40–60% variance compared to audited baselines [1], verifiers closely examine spend-based data for consistency and evidence of improvement plans. Under the PCAF data-quality framework, spend-based MRIO factors score a 4 or 5 - the lowest quality ratings [6].
Auditors also flag risks like "silent restatements", where companies switch MRIO databases (e.g., from EORA to GLORIA) between years, creating apparent emission reductions without any real change in activity [6]. Another common issue is the failure to adjust for inflation, which can artificially inflate reported emissions. If a material category - one accounting for more than 20% of the footprint - remains entirely spend-based in later reporting years without signs of supplier engagement or improvement, it’s often seen as a sign of insufficient progress [7].
"The same procurement spend, run through different MRIO databases, produces emission totals that diverge by tens of percent - and the divergence has nothing to do with anything the company did." - Jeremiah Say, Lead Systems Architect, GreenCalculus [6]
Activity-Based Scope 3 Accounting
How Activity-Based Accounting Works
Activity-based accounting offers a more refined approach compared to spend-based methods. Instead of relying on financial data, this method calculates emissions using physical quantities like tonnes, kilowatt-hours (kWh), litres, or kilometres. These quantities are paired with specific emission factors sourced from lifecycle databases such as ecoinvent, DEFRA/BEIS conversion factors, or the US EPA GHG Emission Factors Hub.
To implement this method, data is collected from procurement manifests, utility meters, logistics reports, and supplier-provided Environmental Product Declarations (EPDs). Each physical unit is then matched with an emission factor that accurately reflects its material type or production process.
Strengths and Weaknesses
Activity-based methods are far more precise than spend-based approaches, with an accuracy range of ±10–20% compared to the ±40–60% variance typical of spend-based methods [1]. This precision stems from tracking actual physical activity rather than relying on financial data, which can be distorted by price changes. However, this accuracy comes at a cost. Implementation can take anywhere from 3 to 12 months and may require significant investment, ranging from £95,000 to over £395,000 annually [1].
| Strengths | Weaknesses |
|---|---|
| Provides high accuracy and detailed insights | Requires extensive data collection |
| Avoids distortions from price fluctuations | Demands robust internal systems and processes |
| Enables tracking of meaningful reductions | Needs careful documentation of emission factors |
When Activity-Based Is Expected
Activity-based accounting is particularly crucial for material Scope 3 categories, such as Category 1 (Purchased Goods and Services) and Category 2 (Capital Goods). It is also the preferred method for setting targets under the Science Based Targets initiative (SBTi) and for scenario analysis, where the precision of spend-based averages falls short for effective modelling [1].
This approach aligns with tightening regulatory standards. For example, the EU's Corporate Sustainability Reporting Directive (CSRD) will require limited assurance by 2026 and reasonable assurance by 2028. These standards demand the kind of robust evidence that only activity-based data can provide. Auditors will expect detailed, activity-based documentation in these submissions [1].
"Switching from spend-based to activity-based data may materially change reported emissions - it reflects improved accounting." - Paul Ferreira, Associate Climate Strategy Advisor, Normative [4]
The shift to activity-based data can have a substantial impact. For instance, one retail company discovered its reported Scope 3 emissions rose by 30% after moving from a spend-based method, which had underestimated the actual emissions. Similarly, IKEA's hybrid approach, which incorporates activity-based data from over 1,600 suppliers, helped the company achieve a 12% reduction in its climate footprint per product between 2022 and 2025, all while expanding its product range [1].
How Verifiers Assess Activity-Based Data
Verifiers view activity-based data as a best-practice approach but scrutinise it carefully. They ensure that physical quantities are derived from primary sources, such as meter readings, weighbridge tickets, or fuel invoices. Additionally, when suppliers serve multiple customers, auditors verify how emissions are allocated among them. Each emission factor must be tied to a specific source document and version - such as the DEFRA/BEIS June 2025 release - to avoid issues like "vintage-mismatch" findings [2].
Under the PCAF data-quality framework, well-documented activity-based data typically earns a score of 2 or 3. This is a marked improvement over the scores of 4 or 5 often assigned to spend-based MRIO factors, further highlighting the reliability of this method [6].
sbb-itb-6ca8558
What Goes Wrong When Spend-Based Defaults Are Used for Material Categories
Why Spend-Based Methods Misstate Emissions in Material Categories
Spend-based methods operate on the assumption that the money spent directly correlates with carbon emissions. But in reality, this linear relationship rarely holds true. For example, if a manufacturer negotiates a lower price for steel, their reported emissions drop - even if the same amount of steel is purchased. On the flip side, when commodity prices rise, reported emissions increase, even if production levels remain unchanged. As Josh Prigge, CEO of North Star Carbon, explains:
"Year over year changes often reflect inflation more than real emissions changes." [5]
This disconnect is particularly problematic for high-emission materials like steel, cement, and road freight, where actual carbon impact is tied to physical quantities rather than monetary value. Additionally, sector-average EEIO factors fail to account for variations in production methods. For instance, a steel supplier using a traditional blast furnace may have emissions five times higher than one employing an electric arc furnace, yet both are grouped under the same sector code [7]. This oversight means investments in greener technologies often go unacknowledged, which weakens the credibility of supply chain decarbonisation efforts.
How Verifiers Challenge Spend-Based Defaults
Because of these inaccuracies, verifiers closely examine the use of spend-based defaults. According to GHG Protocol §7.3.2, auditors investigate whether companies had access to more accurate Tier 1 (supplier-specific) or Tier 2 (activity-based) data but chose to rely on sector averages instead [7]. For instance, if a company has detailed fuel logs or weighbridge tickets in its records but opts for spend factors, this is flagged as both a technical error and a red flag for data quality.
Auditors are particularly critical of companies that repeatedly use spend-based defaults without attempting to collect primary data. While it might be acceptable to rely on spend-based data for a new category in its first year, ongoing use for categories that significantly impact the carbon footprint raises serious concerns [7].
Portfolio-Level Consequences
The problems with spend-based defaults extend beyond individual errors. At a portfolio level, they distort emissions intensity metrics, making it impossible to distinguish between carbon-efficient and carbon-heavy assets within the same sector. This can lead to poor allocation of resources. Research shows that companies relying only on spend-based methods misdirect an average of 30% of their decarbonisation budgets to the wrong emission hotspots [1].
Regulatory pressures are also increasing. Frameworks like SFDR and CSRD now require firms to disclose how much of their inventory is based on primary versus secondary data. A heavy reliance on spend-based factors for material categories signals to regulators and institutional investors that a company’s inventory lacks maturity [6][7]. As assurance standards become stricter, the justification for using spend-based defaults is diminishing. All of this highlights the growing need for more precise, activity-based data in material categories.
Conclusion: Choosing the Right Method in Private Markets
A Category-by-Category Decision Framework
After examining the strengths and limitations of spend-based and activity-based approaches, it's clear that having a structured decision-making framework is essential. Start by using spend-based data to locate high-emission areas, then switch to primary data collection for the most critical categories. The GHG Protocol data hierarchy reinforces this approach - spend-based methods (Tier 4–5) should serve as a temporary measure, not the ultimate solution [7].
Here’s a practical way to approach this by category:
| Category Type | Recommended Method | Rationale |
|---|---|---|
| Activity-dominated (fuel, business travel) | Activity-based (Tier 2) | Physical data - such as kWh, kilometres, or litres - is often already available in internal systems |
| Purchased goods & services | Hybrid (Tier 2 for top 10–20 suppliers; Tier 3 for the rest) | Focuses on the 60–80% of emissions from major suppliers [4][5] |
| Spend-dominated (capital goods, waste) | Spend-based (Tier 4–5) | Collecting primary data from all manufacturers is generally impractical |
As a rule of thumb, if a category contributes more than 20% to your total emissions, verifiers expect a genuine effort to gather primary data [7].
This framework aligns closely with Axion Lab’s tailored solution.
How Axion Lab Supports Defensible Scope 3 Methodologies

Axion Lab’s AI-powered platform is designed to meet the rigorous requirements of private market professionals. Its AI extracts critical activity data - such as mass, volume, distance, and energy use - directly from supplier records and procurement documents, cutting down the manual workload that often makes activity-based accounting unfeasible. For categories where spend-based methods are appropriate, the platform provides clear documentation, including the database used, its reference year, and why primary data was not feasible. This detailed audit trail is exactly what verifiers need to evaluate a mixed-method inventory. Over time, the system’s learning capabilities ensure that factor mapping becomes more reliable and consistent.
Guardrails for Practitioners
Three key principles can help ensure your inventory holds up under scrutiny:
- Use spend-based methods as a starting point. Treat them as a Year 1 tool to screen all 15 Scope 3 categories and identify major emission sources. Then, create a three-year plan: transition to hybrid data for your top 10 suppliers in Year 2, and integrate systematic primary data collection into procurement processes by Year 3 [7].
- Lock in your baseline variables. Record the exact MRIO database version (e.g. EXIOBASE 3.8), the factor reference year, and the currency deflation base before running calculations. Changing databases midway can lead to emission shifts of over 30% without any actual operational changes [6].
- Document decisions thoroughly. Maintain a concise screening table that outlines treatment rationales and your data improvement plan. This can mean the difference between a clean assurance opinion and a qualified one [7][2].
"The goal of Scope 3 accounting should not be perfection in year one. The goal should be continuous improvement." - Josh Prigge, North Star Carbon [5]