Methodology
behind Axion Lab
Our Sustainability Capital Allocation (SCA) method helps funds decide which sustainability actions to prioritise across their portfolios.
November 2026
- Sergei MaslennikovCo-founder
- Ashim PaunSenior Sustainable
Markets Advisor


A roadmap or value creation plan for one portfolio company usually lists 10 to 30 sustainability actions. They serve different purposes. Some actions are required by a law, a loan agreement, or a customer contract. Others lower a cost the company already pays (such as for energy or waste), or protect earnings that a contract puts at stake. Many serve a sustainability ambition — but cost more over the holding period than they add to EBITDA.
The fund has to choose which to pay for, which to defer, and which need further information before acting. Axion Lab's SCA map sorts those actions for a fund: which a law or contract requires, which add to EBITDA or protect it, which need further information, and which to defer. The sections below explain how we built this method, the rules every figure follows, and who checks the work.
1. Existing frameworks
They measure sustainability value across a portfolio, not action by action at one company
In December 2025, we started with the frameworks that funds already use: the PRI's Sustainability Value Creation framework, built with Bain & Company and NYU Stern; NYU Stern's Return on Sustainability Investment (ROSI) methodology; and BCG's Sustainability in Private Markets 2025 report, alongside the work of an industry group, the Sustainable Markets Initiative's Private Equity Task Force.
Each of the three frameworks answers a real question for a fund: which topics create value, how to put a figure on a strategy, and how much sustainability adds to EBITDA. A sustainability lead at a fund also faces a narrower question: which of the 10 to 30 actions on a company's action plan to pay for first. To answer this question, every action needs a price built from that company's own documents and tested against the client's bar, which the fund sets. That is the step we added.
Ashim Paun, our Senior Sustainable Markets Advisor, saw the same gap from the fund's side. As Head of Sustainable Investing at Triton Partners, he published research showing that private-market sustainability analysis is held back by scarce data compared with public markets (Quantifying Sustainability-aligned Revenues, 2025). He also contributed to the World Economic Forum's paper Bridging the Divide: Private Markets and New Drivers of Value Creation (2024).
“With the list of environmental, social and governance factors and indicators seemingly ever-growing, and materiality demonstrable across so many, companies and their owners face a clear challenge in prioritisation — where will the greatest results be achieved, in terms of both financial and sustainability outcomes.”
2. Which actions can be priced
About a third of 3,000+ actions we reviewed follow a pattern that can be priced from the company's own documents
- 3,000+sustainability actions reviewed,
from our own work and the public disclosures of funds and portfolio companies - 1 in 3follow a pattern that can be priced from the company's own documents, such as waste-heat recovery or rooftop solar
- 10 to 30actions on a company's map, each being a decision the company or the fund can take
About a third of the actions reviewed follow a pattern that can be priced from the company's own documents. Recovering waste heat from a process is one: the company's gas bills and a supplier quote give the saving. Rooftop solar is another: the site's meter readings and a supplier quote from an installer give the saving. The rest become a question for the company or remain unpriced, with the reason stated.
A single company's map holds 10 to 30 targeted actions. Each is a specific action: "add a second heat-recovery loop to the dryer", not "an energy-efficiency programme".
3. How the SCA map is built
The map puts each action in one of five groups and states why it belongs there
Axion Lab'sSustainability Capital Allocationmap
Illustrative example. More at demo.axionlab.ai



2. Value protection
3. Value creation
4. Deprioritise
1. Required
Required actions are obligations regardless of value. For example, a law, a permit, a contract clause, a loan covenant, or a commitment already made in public.
- Action 9Conduct energy audit of a factory
- Action 10Calculate full carbon footprint (incl. Scope 3)
2. Value protection
- Action 1Get EcoVadis rating
- Action 8Obtain ISO 14001 certification for the factory
3. Value creation
- Action 4Install solar panels on the factory rooftop (€250k/year of new EBITDA)
- Action 5Improve the factory's energy efficiency with LED lighting and heating controls (€110k/year of new EBITDA)
4. Deprioritise
- Action 2Offset Scope 3 emissions with carbon credits
- Action 3Publish a voluntary sustainability report
- Action 6Install EV chargers at the office car park
5. Get more information
The actions that are neither required nor quantifiable with existing data and context.
- Action 11Replace gas heating with heat pumps. Missing info: gas use per building
- Action 12Refurbish and resell used equipment. Missing info: share of refurbished units
Below EBITDA, not on the map: Action 7, apply for a sustainability-linked loan (€30k a year of lower interest). A loan's effect is a financing effect, so the map lists it and never plots it.
A deprioritised action is not dropped. Instead, its card shows the figure that kept it below the client's bar, and what would bring it back into consideration: a signed contract, a new tariff, or a cheaper supplier quote. On the platform, the company or the fund approves or defers each action, comments on it, and can send Axion a service request.
09Distil the Gent solvent washings
€214k
Estimated Investment
1.1–1.3 years
Payback Period
€0
EBITDA at risk
€164–189k
New EBITDA
Context
Gent sent 188.2 t of solvent washings to incineration in 2025, at €446 a tonne. A supplier distilled three drums of them in April 2026: a 63% to 69% yield, pure enough to reuse as cleaning solvent.
8Assumptions
- 117–132 tSolvent recovered per year
- 62–70 %Recovery yield on Colvea's washings
- 18,336 EURRunning cost of the unit
“Priorities can be both operational and strategic — cost savings with changed practice or capex into new equipment, modified supply lines, and the creation of new business lines in adjacencies to core business which are aligned with major sustainability trends and themes.”
4. Data quality and the client's bar
Every figure shows its source, its two labels, and the client's bar it is tested against
Every figure links to its source document, page, and date. It is produced in one of seven ways, strongest first, and carries two labels: its grade, which says where it comes from, and its basis, which says what kind of figure it is.
Taken from a company document
An invoice, a signed contract, a meter reading
reported · documentedCalculated from the company's own quantities and prices
Energy used times the price, from twelve monthly bills
calculated · documentedThe company's own quantity at a public price
Metered electricity at the Eurostat tariff for that country and consumption band
calculated · estimatedA supplier quote, corrected by its own figures
A solar supplier quote reduced to the power the site can use itself
calculated · forecastA company quantity converted with a published engineering constant
Litres of diesel converted into kilowatt-hours with diesel's published energy content
calculated · estimatedAn estimate from a market benchmark
A sector ratio applied to the company's revenue, with the document that would replace it
assumed · estimatedNo figure yet
Nothing exists and nothing can be built, so the action becomes a question
no figure: a question
| THE TWO LABELS ON EVERY FIGURE | ITS VALUES |
|---|---|
| Grade: where it comes from | reported, from the company's own documents; quoted, from another party's document, such as a supplier quote or a published tariff; calculated, worked out by us from reported or quoted figures; assumed, set by us, with the reason |
| Basis: what kind of figure it is | documented, a definite figure, including a price a contract fixes; estimated, a general figure standing in for the company's own; forecast, a figure about the future that nobody is bound to deliver |
A figure is never firmer than the weakest assumption it uses: a calculation that uses an assumed figure is graded assumed too.
The fund chooses the test that sorts the actions and sets the client's bar for it. We recommend yearly EBITDA, with the client's bar as a share of the company's EBITDA. This test is strict, it is the same for every company in a portfolio, and it is easier to read than a cash flow. A fund can choose a payback within the holding period or a net present value at its own rate instead. An action reaches value creation or value protection only if it passes the fund's test. If the fund changes the test or moves the client's bar, we redraw the map.
By default, the method is strict. A figure produced in ways 1 to 5 can place an action on the map. A market benchmark (6) places it only as a marked estimate, with the document that would replace it. An estimated or forecast figure is also tested at both ends of its range: if the action's group changes, it goes to Get more information. When a decision needs more than the strict figure, such as a net present value or the value at exit, and the fund approves the assumptions, we add these tools from investment banking and private equity.
| DECISION THE FUND FACES | WHAT WE ADD, WITH THE FUND'S APPROVAL |
|---|---|
| Go or no-go on an action | A net present value and an internal rate of return at the fund's own rate over the asset's useful life, a discounted cash flow, and scenarios on the fund's own cases |
| Commercial due diligence or a business plan | Revenue projections and market sizing for sustainability-aligned revenue |
| Sale negotiation at exit | Value at exit: the new EBITDA at the fund's own exit multiple |
By default, these figures appear beside the strict figure. A fund can choose to show them in its place, on the card and in the memo. The card and the memo then mark each such figure as the fund's choice, with its assumptions and who approved them. The map stays in yearly EBITDA, and the strict figure stays in the workbook.
“Before taking any datapoint or calculation to an investment committee or a sustainability team, I verify the document it came from and the assumptions it rested on, to ascertain whether it would hold up when challenged by someone who had not built it.”
5. How our AI platform and senior experts build each map
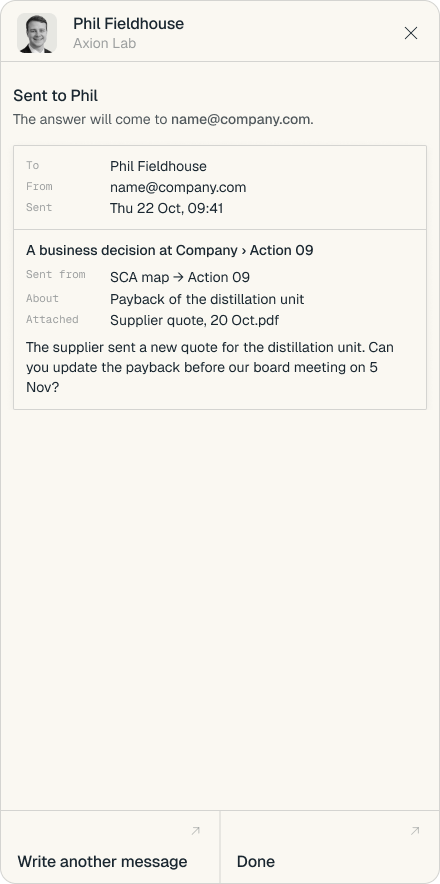
AI prepares each action, an expert checks and signs it, and the company or the fund approves or defers it
Each map goes through six steps. The platform does the reading and the arithmetic, and the expert makes every judgment.
Scoping call
ExpertThe expert and the fund agree the scope, the test that sorts the actions, the client's bar, and the decision the map has to support.
Methodology choice
AI platformExpertThe platform proposes a pricing route for each action. The expert chooses it.
Data and information request
AI platformThe platform lists the documents each figure needs and asks the company for them.
AI processing and drafting
AI platformAI extracts every figure with its page. Code and the workbook, not the language model, compute the figures. AI drafts the card, the memo, and the workbook.
Expert approval
ExpertThe expert reads the evidence behind every figure that decides an action, challenges the estimates, and signs the map.
Steering call
ExpertThe expert walks the fund through the map. The company or the fund approves, comments on, or challenges each action on the platform.

Each action comes with a card on the platform, a memo written like an investment memo with every reference, and a workbook: the inputs, the calculation step by step, a sensitivity sheet that tests each input at both ends, and the sources. Inputs are blue, every result is a live formula, and a column compares each step with the figure in the memo.
For the action on the card above, download the memo (PDF, 12 pages) and the workbook (Excel, 11 tabs). In this example, Colvea's owner, a synthetic fund, asked for the extended views, so the workbook also holds a discounted cash flow and four scenarios.
A team can build this in a spreadsheet for one company. The hard part is doing it with sources for every action, at every company in a portfolio, and keeping it current. AI does that reading and arithmetic, and an expert's name stays on every map.
Operating partners and the teams for value creation, portfolio monitoring, sustainability, and investment use the map to choose the next actions and see their expected effect. Once an action is approved, the platform tracks its status, owner, deadline, and KPI.