In 2025, 95% of corporates surveyed said sustainability was a commercial opportunity, and 99% expected it to drive differentiated competitive advantage over the following three years, according to HSBC's Sustainability Pulse Survey of 1,651 senior business decision-makers across 12 markets. Those expectations don't fund a project. A sustainability business strategy only changes the P&L when each action is forced into a capital bucket with a cost, a hold-period cash effect, and an evidence grade before it reaches the budget.
Most guides stop at the claim that sustainability creates value. Deal teams and portfolio CFOs don't. They ask which line of EBITDA moves, in which year, and what happens if the number is wrong. Reputation, a target year, and a slide of initiatives aren't answers. Scarce capex goes to the action whose financial job is clear, and everything else waits.
Table of Contents
- Rank Every Action by Its Financial Job
- Build the Six-Step Capital Plan
- Match the Plan to What Investors Price
- Run the Target as a Funded Control Loop
- Keep Evidence Comparable Without Faking It
- Lock the Hold-Period Allocation
Rank Every Action by Its Financial Job
A sustainability action earns budget by doing one of four financial jobs: meeting a requirement, protecting EBITDA, creating EBITDA, or waiting until the case is stronger. The hard part is not naming the benefit. It is showing the cost, when the cash effect lands, and what evidence supports the estimate.
Five buckets before the budget
Sort each proposed action into one bucket. Keep the classification tied to its financial job, rather than adding a second scoring system.
| Bucket | Financial job | Capital rule | Hold or drop test |
|---|---|---|---|
| Required | Meet a permit, contract, or financing condition | Fund even if EBITDA is flat | What deadline, fine, contract, or loan condition is at stake? |
| Value protection | Protect EBITDA already at risk | Fund when the downside exceeds the cost | What revenue, margin, or asset value could be lost, and when? |
| Value creation | Generate new EBITDA | Fund when payback fits the hold and evidence supports the case | What incremental margin, price, volume, or cost reduction is expected? |
| Deprioritise | Address a weak or distant effect | Do not fund this cycle | Is there no material risk or near-term cash effect, or a better use for the same capex? |
| Needs more evidence | Establish whether a cash effect exists | Park the action until the case can be priced | Which activity data, owner, boundary, or defensible driver is missing? |
Required actions include a permit, customer contract clause, or loan covenant. Their financial job is avoiding a defined consequence, not generating a new return.
Value protection covers earnings that may disappear if a risk is ignored. Screen material exposures across climate, regulation, supply chain, resources, and talent. State the revenue, margin, or asset value at risk and when it could be affected. If the downside cannot be quantified, put the action in Needs more evidence.
Value creation means new EBITDA with payback inside the hold. If the cash benefit falls after exit, the case needs a credible reason the buyer will pay for it. A forecast without a clear driver is not enough.
Deprioritise actions with weak, distant, or reputation-only effects. Keep them on a watch list, but do not let them displace this cycle's capex without a material risk or a nearer-term cash case.
For every action that stays live, record its financial mechanism: cost out, revenue defence, growth, financing access, or compliance. A boiler retrofit may reduce operating costs. A customer carbon clause may put revenue at risk. A product redesign belongs in growth only if its price, volume, or margin case is supported. A covenant is a compliance requirement; a facility's margin condition may make it a financing-access issue.
A board should challenge the bucket and the evidence behind it, not just the sustainability theme. Targeted board-level training on sustainability can help directors examine those distinctions. For purchased goods or use of sold products, apply the same cash test when ranking Scope 3 categories by importance, then prioritise the exposure that can affect EBITDA during the hold.
Build the Six-Step Capital Plan
A transition plan that never reaches the capex schedule is a disclosure, not an investment program. CDP shows that 72% of companies report having emissions-reduction initiatives, but only 11% disclose capital expenditure aligned with their transition strategies. That gap is the failure mode to avoid.
Take a mid-market manufacturer choosing between a boiler and heat-recovery project with metered fuel data, and a product claim that has no volume evidence. Leading companies can often pursue the first 20–40% of decarbonization while reducing costs. McKinsey examples cited with that CDP benchmark reach up to 40% emissions reduction and up to 15% financial-performance improvement. Treat those figures as a ceiling to test against this plant's meters, not as a target to paste into the model.
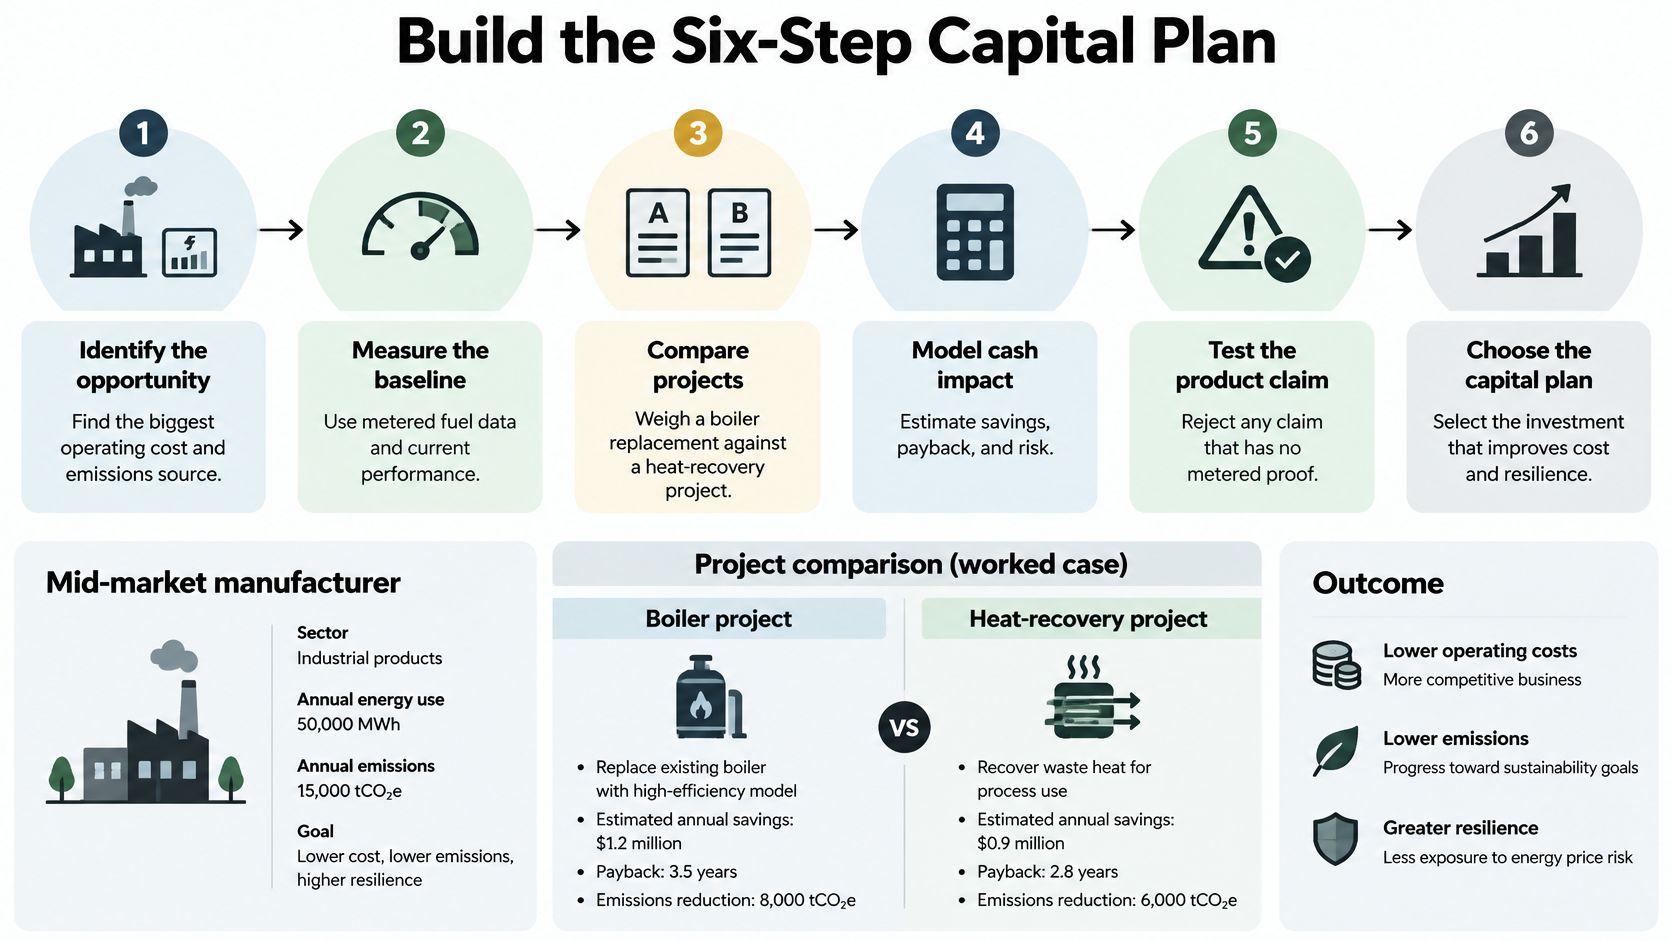
The six steps, on one plant
Set one baseline. Cover Scope 1, Scope 2, and material Scope 3 only. Use one organizational boundary and one global-warming-potential basis. For the manufacturer, that starts with metered gas and electricity at the site, plus the purchased materials that dominate the footprint. Don't open every category because a template lists it.
List levers, not themes. Operations, product, procurement, and financing are the menus. "Net zero culture" isn't a lever. The boiler replacement, the heat-recovery loop, a supplier specification, and a margin step on a sustainability-linked facility are levers. Drop any label that has no owner and no cash line.
Quantify before you rank. For each lever, write abatement, capex, opex, recurring savings, revenue, EBITDA effect, and the dependency that could block it. A heat-recovery project blocked by a six-month outage window isn't the same project as one that fits a planned shutdown. Put the outage in the case.
Apply the five buckets already defined. Once fuel savings and downtime risk are priced, the boiler or the heat-recovery project lands in value protection or value creation. The product claim stays in needs more evidence until volume and price are evidenced. Don't build a second scorecard that reopens the argument.
Assign an owner, a milestone, and the file that proves it. "Engineering" isn't an owner. A named plant manager, a commissioning date, and the meter extract that will show the fuel drop are. If the file doesn't exist yet, the milestone isn't real.
Put only funded items into the system. Budget, investment-committee paper, board reporting, and incentives should carry the same rows. An initiative that lives only in the sustainability appendix will lose the argument when capex is tight.
What the paper has to contain
Each funded case needs discounted cash flow or NPV, payback, capex and opex, carbon-price sensitivity, operational risk, and exit relevance. Say the heat-recovery project pays back inside the hold on metered fuel, and the boiler only pays back if a carbon price is assumed. The committee can still choose the boiler for uptime. It shouldn't pretend the two cases are equal.
Generic emission factors without activity data, a stated boundary, and an uncertainty range won't survive a lender, a buyer, or a board review.
Document the meter source, the factor, the boundary, the range, and the manager who owns the number. That file is what makes the sustainability business strategy traceable when someone who wasn't in the room challenges it.
Match the Plan to What Investors Price
A sustainability action belongs in the investment case only when its financial job is clear. In a McKinsey survey of investment professionals, approximately 85% of chief investment officers considered ESG an important factor in investment decisions, about 60% reviewed their overall portfolios for ESG considerations, and roughly 80% assessed individual company positions based on how ESG factors affected forecast cash flows.
Start with that cash-flow test: which forecast line changes, when, and by how much? Put each action into a capital bucket, then show its cost, hold-period cash effect, and evidence grade. If capex is missing or the EBITDA case depends on an untested assumption, the board should see that gap before it approves the spend.
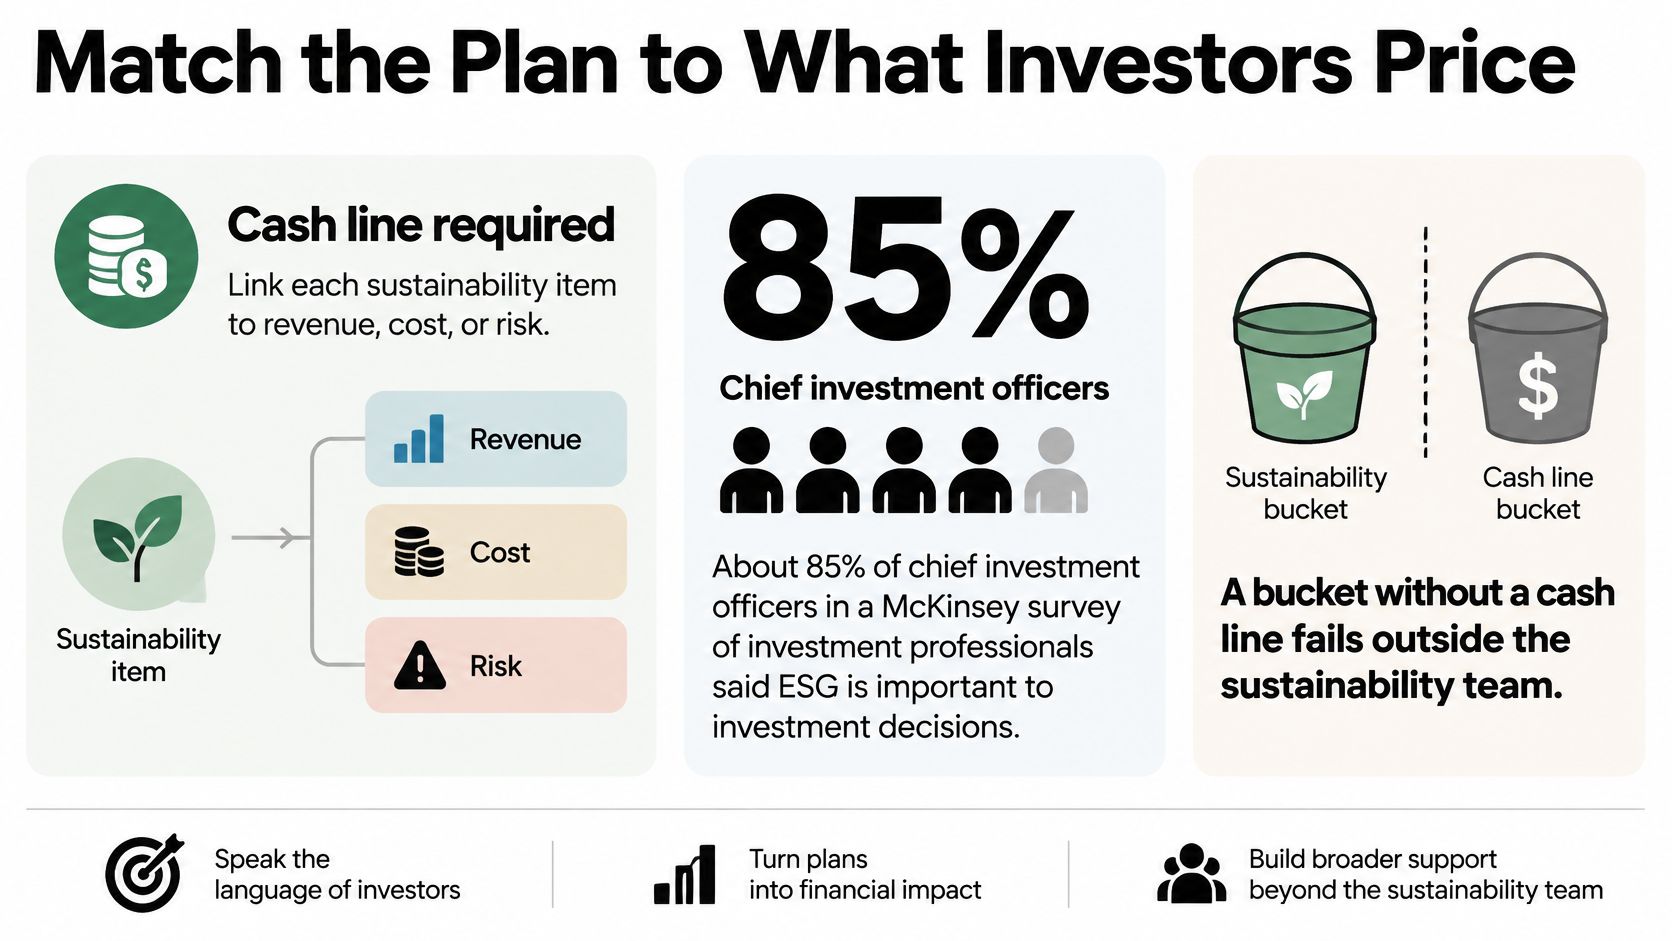
Six answers, already in the model
Every funded action should answer six questions using the company's existing plan and financial model:
- Revenue: Which customer, price, or volume assumption changes, and in which year?
- Margin: Which cost falls, or which mix shifts? Is the effect on gross margin or EBITDA?
- Return on capital: What capex is required, and does the payback fit within the hold?
- Financing access: Which facility, covenant, or margin ratchet depends on the action?
- Risk exposure: Which loss, downtime, or contract breach becomes less likely, and what does that risk currently cost?
- Talent: Which retention or hiring measure supports the case, rather than a general claim about purpose?
Tie each answer to a model line: a revenue assumption, cost saving, loan term, risk estimate, or retention figure. Where the evidence is weak, label the assumption and show how the financial result changes if it fails. A sustainability label alone does not fund the action.
Disclosure timing is a constraint
Sustainability disclosure effective dates vary by jurisdiction and entity type. Confirm the applicable regime with the company's advisers before setting reporting deadlines or committing resources.
Build a traceable base from definitions, source documents, assumptions, calculation methods, and estimates. Use the same figures for capital allocation and any later financing, governance, or disclosure decision. If a lender asks for support and the figures cannot be reproduced, the business has a data-control problem, not merely a reporting delay.
Run the Target as a Funded Control Loop
Only 32% of companies in CDP's 2025 findings reported having a climate transition plan, according to the CDP corporate environmental action tracker methodology. Among companies that committed in 2023 to develop one within two years, 41% had delivered and 52% said they remained on track. Having a target and executing it are different facts.
Companies with transition plans were nearly twice as likely to identify short-term growth and cost-saving opportunities as companies without them, 51% versus 28%. The useful reading isn't that a PDF creates savings. It's that teams who turn a pathway into funded work are the ones who can name a near-term cash effect.
A quarterly loop, not an annual pledge
Run the target as a control loop on the same boundary already used for capital.
Lock the absolute baseline. Intensity can sit beside it. Intensity alone hides a rising total. The organizational boundary stays the one in the capital plan, so the emissions line and the capex line describe the same company.
Set a near-term and a long-term pathway, then fund the year. Translate both into annual operational milestones that carry a budget line. A 2030 number with no spend this year isn't on track.
Compare actual emissions with an explicit trajectory. CDP's method calculates expected emissions for the reporting year on a stated linear path between the base year and the target year. Use that, or another path you write down. Progress is then testable instead of narrated.
Investigate variances above a pre-agreed threshold and refresh the capital plan. Include a contingency if a lever slips. A heat-recovery project delayed by a shutdown doesn't get a footnote. It gets a revised cash case and a decision.
Tie one named owner to incentives. Executive and operating-team incentives should point at the milestone, not at "sustainability progress." If two people own it, nobody does.
On track means funded actions, a quarterly variance, retained evidence, and an escalation rule when the path is missed. A slide that says "on track" without those four items isn't a control.
The quarterly board pack can stay at three lines: variance versus trajectory, capital still funded, and the decision requested. Tools that keep the actuals next to the budget, rather than in a separate sustainability file, are covered in a practical look at ESG reporting software. What breaks the number itself, offsets, missing Scope 3, and false comparability, is the evidence problem.
Keep Evidence Comparable Without Faking It
Bad evidence changes the investment, the loan discussion, and exit readiness. It isn't a reporting tidy-up. In 2025, 91% of CEOs surveyed by KPMG said differences in sustainability regulation and expectations across markets created significant or moderate challenges. Leading net-zero barriers in that survey were decarbonizing supply chains at 22%, inconsistent regulation at 20%, cost at 16%, and insufficient skills at 15%.
Morgan Stanley's 2025 survey, cited in the same discussion of cross-market friction, found that 16% of companies globally struggled to understand current sustainability performance, rising to 22% in APAC. At the same time, 63% of private-market investors said sustainability and carbon-reduction efforts were more important in investment decisions than 18 months earlier. More attention, weaker self-knowledge, and uneven rules is a bad mix for a single portfolio score.
One method, visible company evidence
Use one shared method for definitions, boundaries, and calculation order. Keep each company's activity data, assumptions, and uncertainty visible. Standardized metrics can benchmark a fund. They shouldn't erase business model, geography, data maturity, or the control environment.
An estimate can be enough to prioritize inside the hold. It isn't enough for a sustainability-linked loan KPI, a disclosure figure, or assurance. Expert review of a calculation isn't an independent assurance opinion. Say which of those the number is allowed to support.
| Failure | What it hides | Correction |
|---|---|---|
| Intensity target only | Absolute emissions can still rise | Report absolute emissions next to intensity |
| Unverified offsets counted as progress | Operations are unchanged | Split offsets from operational reduction |
| Material Scope 3 left out | The largest lever is invisible | Include material categories or say why not |
| Target with no capex line | The plan is a disclosure | Tie each milestone to a funded budget line |
| One score across portfolio companies | Different models and data maturity | Same method, company evidence kept separate |
| Estimate used as a loan or assurance figure | The number will be challenged | Upgrade evidence before financing or disclosure |
The first rows are the everyday failures. An intensity drop with rising tonnes, offsets booked as if the plant changed, and a footprint that skips the category that dominates spend. The financing failure is the last row. A prioritization estimate, once pasted into a loan KPI or an assurance pack, will be challenged on boundary, factor, and owner. Upgrade the evidence before that use, or don't use the number.
Choosing a framework doesn't fix a missing meter reading. It only helps if the boundary in the framework matches the boundary in the cash case, which is the practical point of comparing ESG reporting frameworks against the decision the number has to survive.
A lesson from one portfolio company can suggest the next test at another. Run that test only after the second company's own evidence is checked.
False comparability is more damaging than a gap. A gap can be parked. A blended score gets reused in underwriting, in a lender meeting, and in an exit memo, and each reuse makes the weak number harder to walk back.
Lock the Hold-Period Allocation
A hold-period allocation is useful only if the board can see what is funded, what remains conditional, and why. Keep one register for the next budget or investment committee. Separate required actions, value protection with EBITDA at risk, value creation with payback during the hold, items to deprioritise, and actions parked until evidence is available.
For every funded action, show its cost, EBITDA created or protected, owner, and next review quarter. A missing payback is an unpriced claim, not a conservative estimate. Keep it off the commitment list until the financial case can be assessed.
The sequence inside a private-equity hold
Fund required work first, then protect earnings already underwritten, then assess opportunities to add earnings before exit. This ordering helps prevent an attractive growth case from displacing a deadline or putting base-case margin at risk. Deprioritised actions do not belong in the funded core.
Build the register from documents the company already holds, such as metered energy data, supplier contracts, loan agreements, and the current project list. If a document cannot support a cost or cash-effect estimate, park the action until the missing evidence is available.
The sustainability lead keeps the final say over the ranking. Expert review can challenge weak assumptions before capital is committed, while formal papers for financing, governance, or exit decisions can draw from the same underlying analysis.
Axion Lab starts each engagement from a Sustainability Capital Allocation map built from the company's existing documents. Each action is priced by the EBITDA it creates or protects, its cost, and its payback. The map groups actions as Required, Value protection (EBITDA at risk), Value creation (new EBITDA), and Deprioritise. The first three groups form the funded core of the register; anything still unpriced stays off the commitment list.
Before approval, check that each proposed commitment has a credible cost, a hold-period cash effect, and evidence that supports the estimate. That is the sustainability business strategy a board or lender can challenge.
Axion Lab provides sustainability analysis and reporting for private equity funds and portfolio companies. Its capital allocation map connects proposed actions to EBITDA, costs, and expected returns, with formal reports produced from the same analysis when investment, financing, governance, or disclosure decisions require them. Learn about Axion Lab's approach at Axion Lab.
Drafted with the Outrank app